Tag Maps Python Implementation, HDBSCAN and Emoji Clustering
by alexdunkel
An email today made me aware that I really need to update the YouTube video tutorials on Tag Maps to the new Python implementation. This made so many things easier. The time for processing data for a typical map based on 200,000 photos is now down from 1 hour to 2-5 Minutes (kudos to the stunningly fast single-linkage implementation in HDBSCAN). In fact, ArcGIS is really only needed for final mapping of data – I am still a bit away from replacing the ArcGIS Label Engine.
The great Unicode handling in Python also makes it possible to produce Tag Maps with special characters (København example) and, emojis.
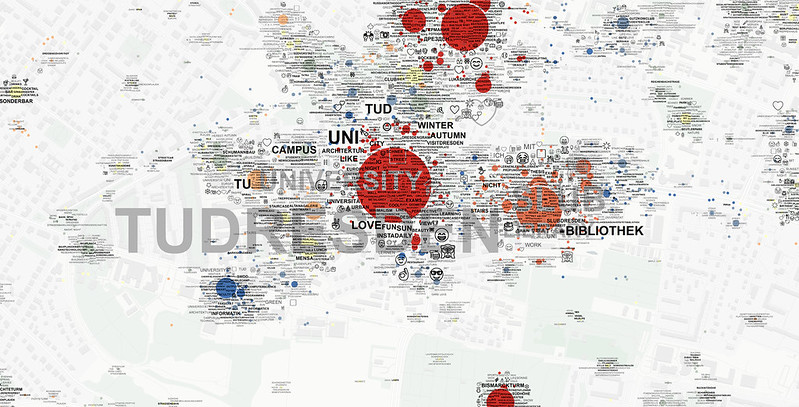
The TU Dresden Campus Tag Map above is based on a combined data set from Flickr and Instagram. It is exciting that this worked so well because each service represents quite different groups of users, which helps portraying a more representative image with these maps. In addition, a 3rd layer was added based on Emoji Clustering. The Emojis on this map were processed equally to the clustering of tags. Emoji clustering is done in a separate step and layers are only merged at the end for visualization. Especially on Instagram, emojis emerge as a new form of communication which is suitable for conveying specific meaning to others. In the resulting emoji-tag-map, both tag and emoji layer seem to complement each other.
There’s a series of upcoming Workshops where I will talk about the new Tag Maps process [February: Kassel, Germany (Regional Planning); March: Virginia Charlottesville, USA (Architecture & Urban Planning) and Leibniz Institut für Länderkunde in Leipzig (Regional Geography Science)]. I hope that I have enough time to update the online Tutorials afterwards. Until then, have a look at the GitHub Tag Maps page which provides at least some information.
