Painted by 1,387,131 Artists
by alexdunkel
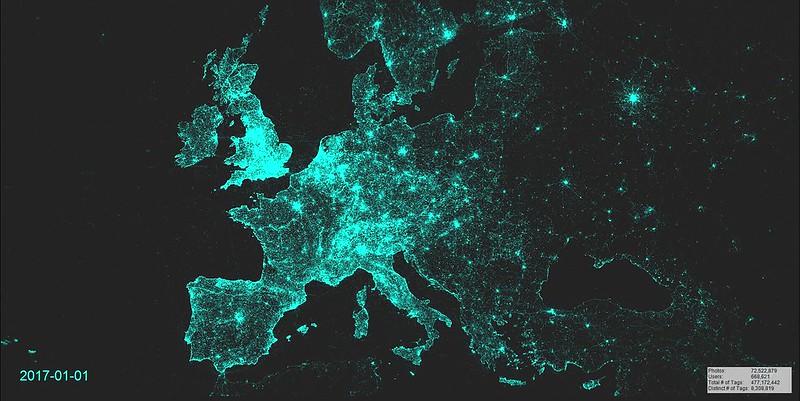
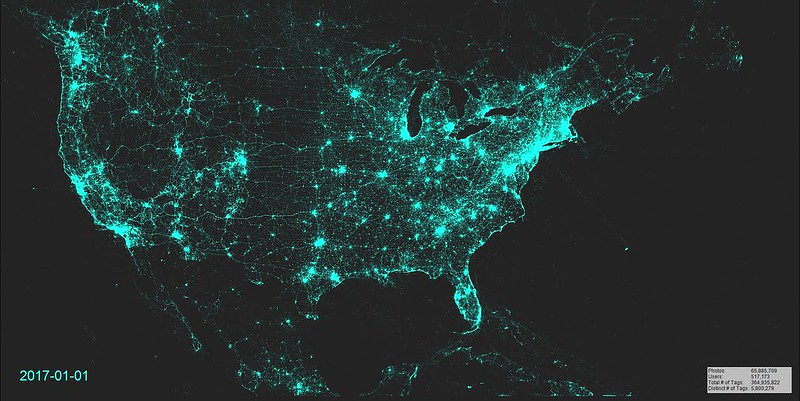
The temporal aspect often isn’t visible in static visualizations, but time & space aren’t separable. These visualizations show how Flickr users ‘paint’ a collective map of spatial photo attribution and valuation by contributing thousands of personal experiences each day from 2007 to 2017. The first animation shows global photo locations, with accentuation of areas in Europe, North America and parts of Asia.

In Europe (second animation), one can see how linear landscape elements get explored over time such as the Loire continually increasing in brightness as people take pictures along its course. Some users have a larger effect on the visuals than others: those who first visit and upload pictures of a specific geographic area (the ‘early adopters’) cause black pixels switching to color. This is particularly obvious for some linear routes appearing gradually on the map (a photo-documentary of a ferry trip from Amsterdam to London, a hike along the Camino de Santiago, a bike trip along the coast etc.). Lots of interesting patterns to observe here!